In this
article:
Using the Debugger
Conclusions
Navigation:
HomeHardware
Software
Techniques
Controllers
Reviews
Index
Introduction
One of the challenges I took on was to move all of my development for embedded systems to Linux. The reason I took this challenge on is because I currently own hardware that I bought which I can no longer use because its development tools run on an operating system that is no longer existent (Windows98 in this case). And the amazing bloatware that some packages manufacturers foist upon you, like Atmel Studio 6+, really try my patience.
Embedded software development is extremely straight forward, you don’t need a GUI based IDE, you don’t need wizards for writing your software, all you need are a compiler, a debugger, and a simple text editor. All of which are available “for free” as open source products. The key insight for chip makers, if you are reading this, is that software tools should not be a profit and loss center in your operation, they should strive to lower the friction for getting things done on your chips. Do that, and you get customer loyalty, don’t do this, and you build resentment that incites engineers to move to a different platform.
The Sticky Bit: Debugging
These days even the “paid” products usually use the GCC toolchain for doing development. The process is pretty much the same everywhere, edit source files, compile them, and then link them into an “image” which can be transferred to the target system and run.
Primitive debugging in embedded systems usually means doing something like flipping a GPIO and watching an LED turn on or off, where an LED state change is indicative of code being called or perhaps failing. More sophisticated debugging involves sending out progress messages to a serial port (UART) which are captured by a serial port terminal “emulation” program (or a real terminal if you are hard core!). But the best way to debug code on an embedded system is using the manufacturer’s debugging port and hooking your tool chain right into that. This lets you get down and dirty with the hardware and see what is happening, and watch when things go wrong. No more guessing about what a variable contained when you entered a routine if you can just look at it. The problem is that if you need to use a proprietary interface to do that, you are stuck running the manufacturers tool on the operating system they happen to support (usually some flavor of Windows) Enter the Black Magic Debugging Probe from BlackSphere Technologies.
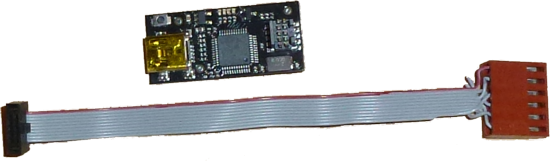
The probe, shown above, is really very cool. It is also very small. The size actually threw me off for a bit when I got one as I really hadn’t internalized this picture with the ruler next to it. It is small, and the 10 pin connector uses 50 mil spacing. That is also quite small. So before I could use it with the STM32F4-Discovery board, I needed to adapt it to connect to the 6 pin SWD connector.
You can see my cable in the image above, basically you can buy a pre-made IDC cable (10 pin to 10 pin) from Digikey by ordering part number SAM8218-ND and then modifying it.
To modify the cable you need to cut off one end, add crimp on plug connectors and then install it in a 6x1 Molex KK connector. This is delicate work but not impossible. The TI EKS-LM4F232 board actually as a 10 pin, 50 mil, JTAG connector on it so you can use the cable unmodified.
Note that the cable connectors are polarized, one of the cable ends plugs into the BMP and the cable exits from the board, the other end requires that the cable be bent back on itself. I used the side that could go straight out without bending for aesthetic reasons. Once you have removed one end of the cable, use a razor blade to initially separate the individual connectors for a short distance and then used your fingers to pull them apart for about 1". The reason you use your fingers is that the insulation naturally breaks between the conductors and you get individual wires with insulation all around on them that way as opposed to exposed wires.
After separating them use a wire stripper to remove about 3/16" of insulation from the end, twist the exposed connectors, and then use a bit of solder to tin them. This keeps the wires together and after crimping you can heat the pin up to have the solder reflow in the crimped connection.
I chose to use the KK connector and crimp on pins. But that is because I have a connector kit I got a while ago with a variety of sizes. Any connector solution that is 0.100" spacing (2.54mm) and can crimp on to free hanging wire would work.
Once you have the plugs on, insert in the housing in the sequence shown below (Gareth McMullin provided this information in an email)
| BMP Cable | SWD Connector | |
|---|---|---|
| Target VDD | 1 | 1 |
| SWDIO | 2 | 4 |
| SWCLK | 4 | 2 |
| TRACESWD | 6 | 6 |
| GND | 9 | 3 |
| NRST | 10 | 5 |
The pins 3,5,7,8 are not used for the SWD case so you can use some wire nippers and cut those wires back. You can see the result of my efforts in the picture up above.
Using the Debugger
Ok so once you have this thing set up how do you use it? That turns out to be where the magic part comes in. If you browse the source code for the probe you will see it runs a GDB server which is connected to a virtual USB serial port. Using an ARM gdb (I use the summon tool chain although that project has since been supplanted by official ARM support. Either can produce a working arm-none-eabi-xxx set of binaries which are used to build “bare metal” applications, there is no Linux on the target support etc.
When you plug in the BMP it will show up as two serial ports
(/dev/ttyACM0 and /dev/ttyACM1 if you don’t have any other ACM
type USB serial adapters plugged in). To connect to the GDB server you
type what is in blue below:
GNU gdb (Linaro GDB) 7.5-2012.12-1
Copyright (C) 2012 Free Software Foundation, Inc.
License GPLv3+: GNU GPL version 3 or later <http://gnu.org/licenses/gpl.html>
This is free software: you are free to change and redistribute it.
There is NO WARRANTY, to the extent permitted by law. Type "show copying"
and "show warranty" for details.
This GDB was configured as "--host=x86_64-unknown-linux-gnu --target=arm-none-eabi".
For bug reporting instructions, please see: <http://bugs.launchpad.net/gdb-linaro/>.
(gdb) target extended-remote /dev/ttyACM0
Remote debugging using /dev/ttyACM0
(gdb) mon swdp_scan
Target voltage: 0.0V
Available Targets:
No. Att Driver
1 STM32F4xx
(gdb) attach 1
Attaching to Remote target
0x08000636 in ?? ()
(gdb)
First you invoke the ARM gdb from the shell, next you use the gdb command
to set the target to ‘extended remote’ communicating over /dev/ttyACM0
(the serial port). The mon command can scan using either SWD
(swdp_scan) or JTAG (jtag_scan) and identify if the probe is
connected to the debug port of your board. In this case it saw the
STM32F4-Discovery board as target #1. Using attach 1 you connect to
the running program. It interrupts the running code and drops you into
the debugger.
If you are going to debug a new bit of code you use the standard gdb commands like so:
A program is being debugged already.
Are you sure you want to change the file? (y or n) y
Reading symbols from
/filer/cmcmanis/arm-experiments/libopencm3-examples/examples/stm32/f4/stm32f4-discovery/lcd/lcd_demo.elf...done.
(gdb) load
Loading section .text, size 0x2284 lma 0x8000000
Loading section .data, size 0x10 lma 0x8002284
Start address 0x8001b79, load size 8852
Transfer rate: 16 KB/sec, 885 bytes/write.
(gdb) break main
Breakpoint 1 at 0x80016b8: file lcd_demo.c, line 151.
(gdb) run
The program being debugged has been started already.
Start it from the beginning? (y or n) y
Starting program:
/filer/cmcmanis/arm-experiments/libopencm3-examples/examples/stm32/f4/stm32f4-discovery/lcd/lcd_demo.elf
Note: automatically using hardware breakpoints for read-only
addresses.
Breakpoint 1, main () at lcd_demo.c:151
151 main(void) {
(gdb) list
146 }
147 gfx_drawRect(135, 35, 50, 135, GFX_COLOR_WHITE);
148 }
149
150 int
151 main(void) {
152 /* configure FSMC for bank 4 static RAM */
153 uint16_t toggle = 0;
154
155 clock\_setup();
(gdb)
Looking at the blue commands you can see you set the file you are
going to debug with the file command, load it into flash & RAM (gdb
will automatically flash it into RAM if that is where the segments
load), and set your break points and run. From that point on it works
like any other gdb session you have used. Look at variables with
print, or set watch points with watch. All the fun of running GDB
but on an embedded target.
Conclusions
The Black Magic Probe works well. If I were at ST Micro, TI, or Atmel I would consider making it the standard ‘built in’ programming interface for evaluation boards since GDB on Windows, Mac, or Linux can all talk to it. It leverages the standard debugging interfaces that are part of the ARM specification and for the ST Micro and TI boards it worked right out of the box (caveat making a cable for it). Bottom line is that this tool has increased my productivity and moved me one step closer to being rid of Windows for embedded development.